


Entering into the world of monitoring
Monitoring is an essential aspect of any organization as it enables them to collect, analyze, and use data to manage and enhance their existing system architecture and its components. By monitoring, an organization can detect problems in its system before they cause significant issues, ensure efficient utilization of resources, prevent wastage and duplication, and learn from previous mistakes and successes to promote better decision-making.

Overall, monitoring improves transparency and accountability within organizations. To enable monitoring functionality, various monitoring tools, and systems are available that can make an organization more agile, responsive, and impactful.
The information collected for monitoring varies based on the organization's requirements. We classify this information into two main categories: Logs and Metrics. Different sets of tools are available for each of these categories. For example, Logstash can be used for logs, while Prometheus can be used for metrics.
What are metrics?
To understand what metrics are, let's consider a scenario where we have an application running on a data center that includes firewalls, routes, database services, compute units, and a Kubernetes cluster. As an admin, it's important to constantly monitor the resources to ensure that any issues are detected and addressed promptly.
To do this, we need to collect information on CPU utilization, RAM, network, and other relevant factors to understand why the end application may be down or running slowly. This numerical data, collected at regular intervals, regarding our resources and services, is referred to as metrics.
However, if we want to identify the root cause of why a particular program is consuming more or fewer resources, we would perform root cause analysis with the help of logs.
How Prometheus comes into the picture?
Now that we understand what metrics are, it's worth noting that most programs and applications can display their metrics in the form of a file or by directly exposing the metrics to the outside world. For instance, the Apache web server has the capability to collect metrics and expose them to the external world.
However, the real challenge comes when we need to analyze these metrics, as we require storing them as time-series data before performing the analysis. Unfortunately, most products lack a time-series database to store this data. This is where Prometheus comes in - it can collect the metrics from the Apache web server and store them in its time-series database, enabling easy analysis.
As programs collect metrics in large numbers, it becomes crucial to search and perform queries on this data for proper analysis and better decision-making. This is where Prometheus's PromQL query language comes in handy, as it can be applied to the data stored in its time-series database to efficiently retrieve and analyze the required metrics.
Now we need to understand our requirements it's important to have programs that can not only monitor or analyze the metrics but also provide alerts in the case of abnormal behavior or when thresholds are breached. Fortunately, we can define our alerting rules in Prometheus based on the collected metrics, which can trigger notifications in such situations.
How does Prometheus work?
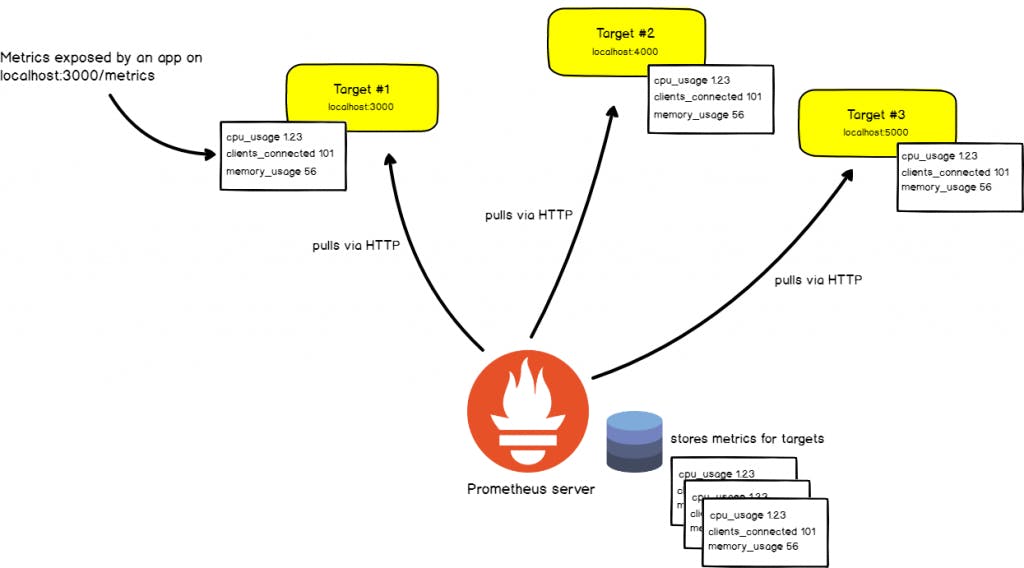
To understand how Prometheus works, we can divide the system into two parts: the Prometheus server and the Prometheus targets. The Prometheus server is responsible for collecting, storing, and querying metrics data. It exposes an HTTP endpoint that scrapes metrics data from instrumented targets, which can be applications, services, servers, or any other system components that expose metrics data in a supported format.
However, there may be cases where the instrumented targets do not have native support to expose metrics data or the metrics data provided is not in a supported format. In such cases, Prometheus provides exporter programs that are small agents that run on the instrumented targets to expose metrics data in a format that Prometheus can understand. These exporters come in various types, such as the Node Exporter for collecting system-level metrics, the Apache Exporter for Apache web server metrics, and the MySQL Exporter for MySQL database metrics. These exporters bridge the gap between Prometheus and the instrumented targets, ensuring that Prometheus can scrape and understand the metrics data.
Hands-on over Prometheus
Setup
Here we will be launching 2 instances (VM) where one will be running the Prometheus server and the other will be our target node.
We will be setting up the node_exporter program on our target node so that it can be monitored.
We will be installing and configuring the Prometheus in the Prometheus server and also ask it to monitor our target node with the node_exporter program running
| Instance Names | Public IP | Private IP |
| Prometheus server | 43.204.35.49 | 172.31.42.178 |
| Target node 1 | 35.154.147.222 | 172.31.47.138 |
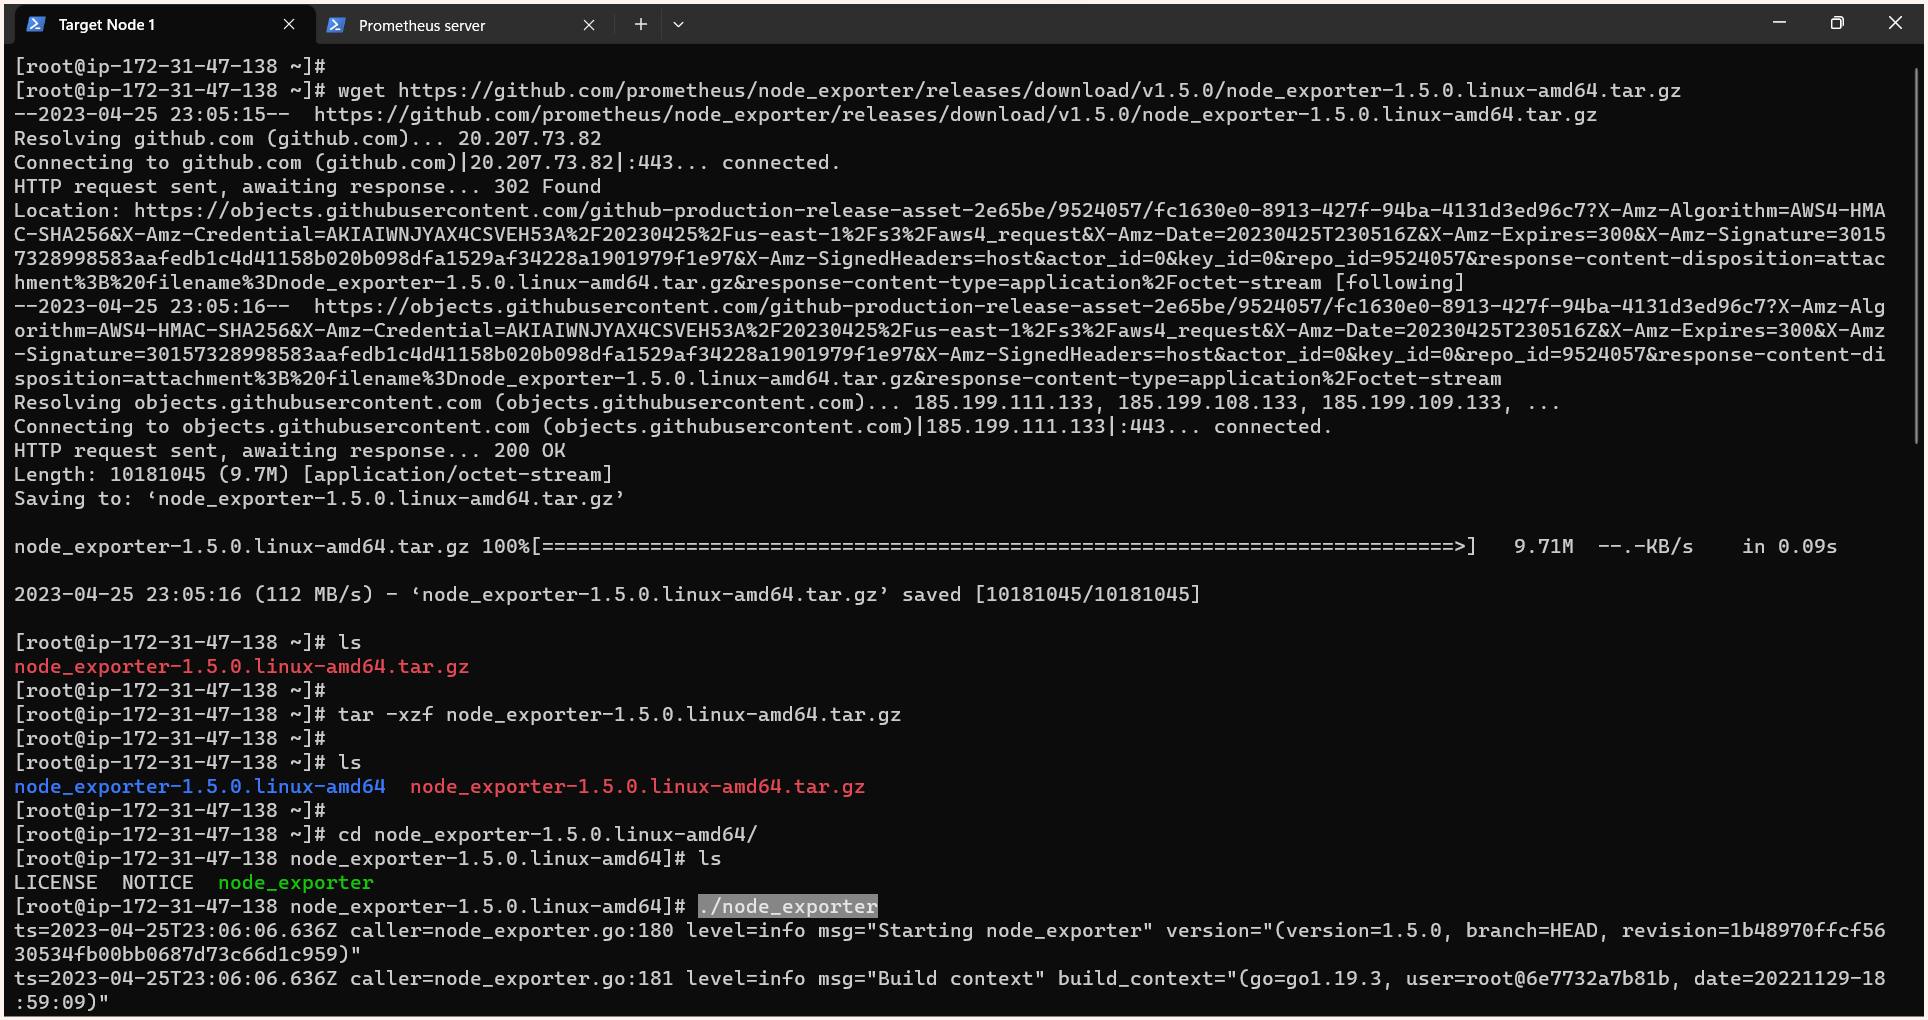
Setting up the node_exporter program
At the most, we will be installing the node exporter program for collecting system-level metrics.
We can download it from here: https://prometheus.io/download/
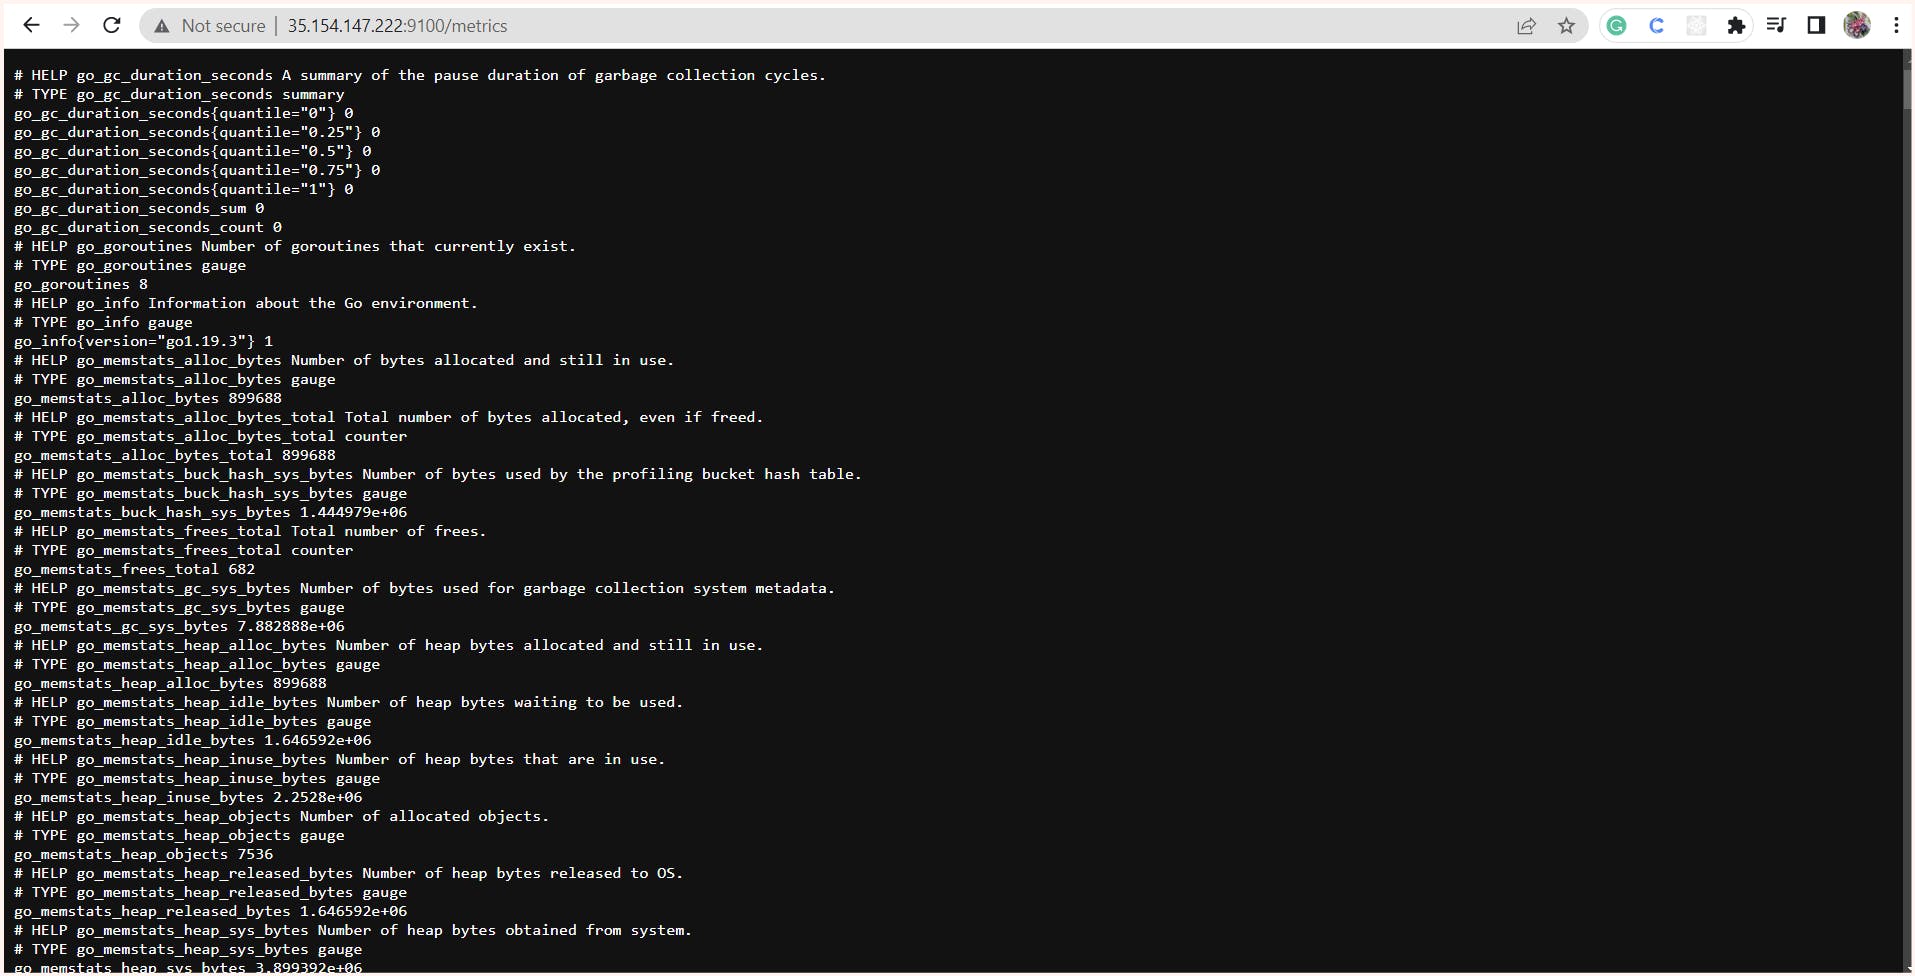
By default, this node exporter runs on the port 9100 so if we hit the http://<target_node_ip>:9100/metrics we can see the metrics in the browsers too.
$ yum install httpd -y
$ wget https://github.com/prometheus/node_exporter/releases/download/v1.5.0/node_exporter-1.5.0.linux-amd64.tar.gz
$ tar -xzf node_exporter-1.5.0.linux-amd64.tar.gz
$ cd node_exporter-1.5.0.linux-amd64/
$ ./node_exporter  #command to start node_exporter program at port 9100
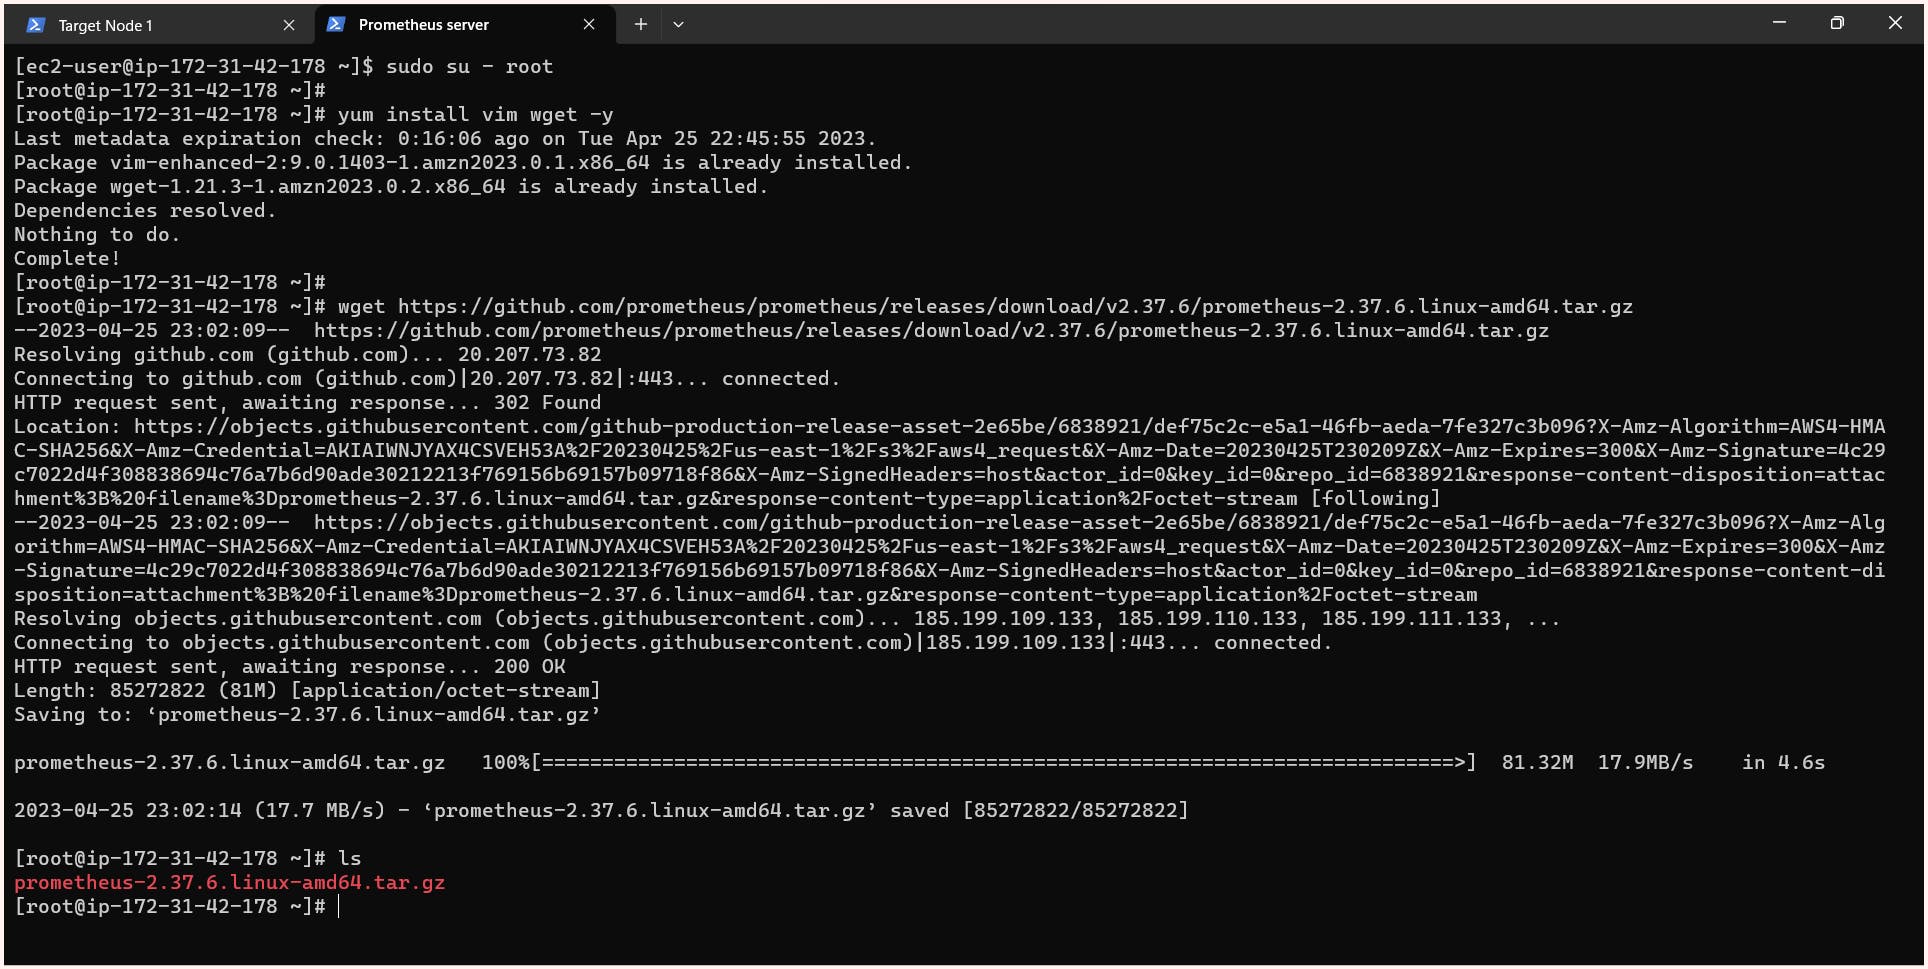
Installing and configuring the Prometheus server
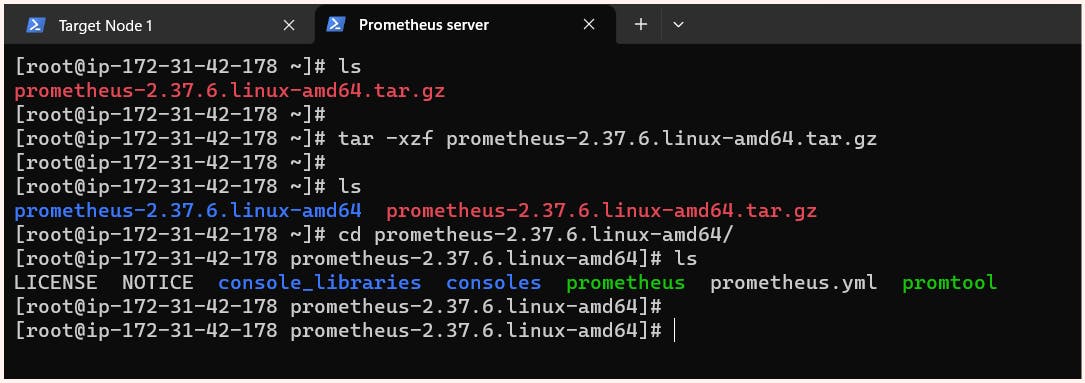
At the most, we need to install the software for Prometheus which we can get from https://prometheus.io/download/
Here we are provided with a Prometheus configuration file (prometheus.yml) and a command to start the Prometheus server at port 9090
In the configuration file, we specify the target nodes in the scrape_configs section. While we can manually add targets to the Prometheus configuration file, in a dynamic environment, Prometheus can perform service discovery to determine the IP of our target machine automatically.
In addition to specifying targets, we can also adjust the scrape_interval - the frequency with which Prometheus fetches new metrics from the targets.
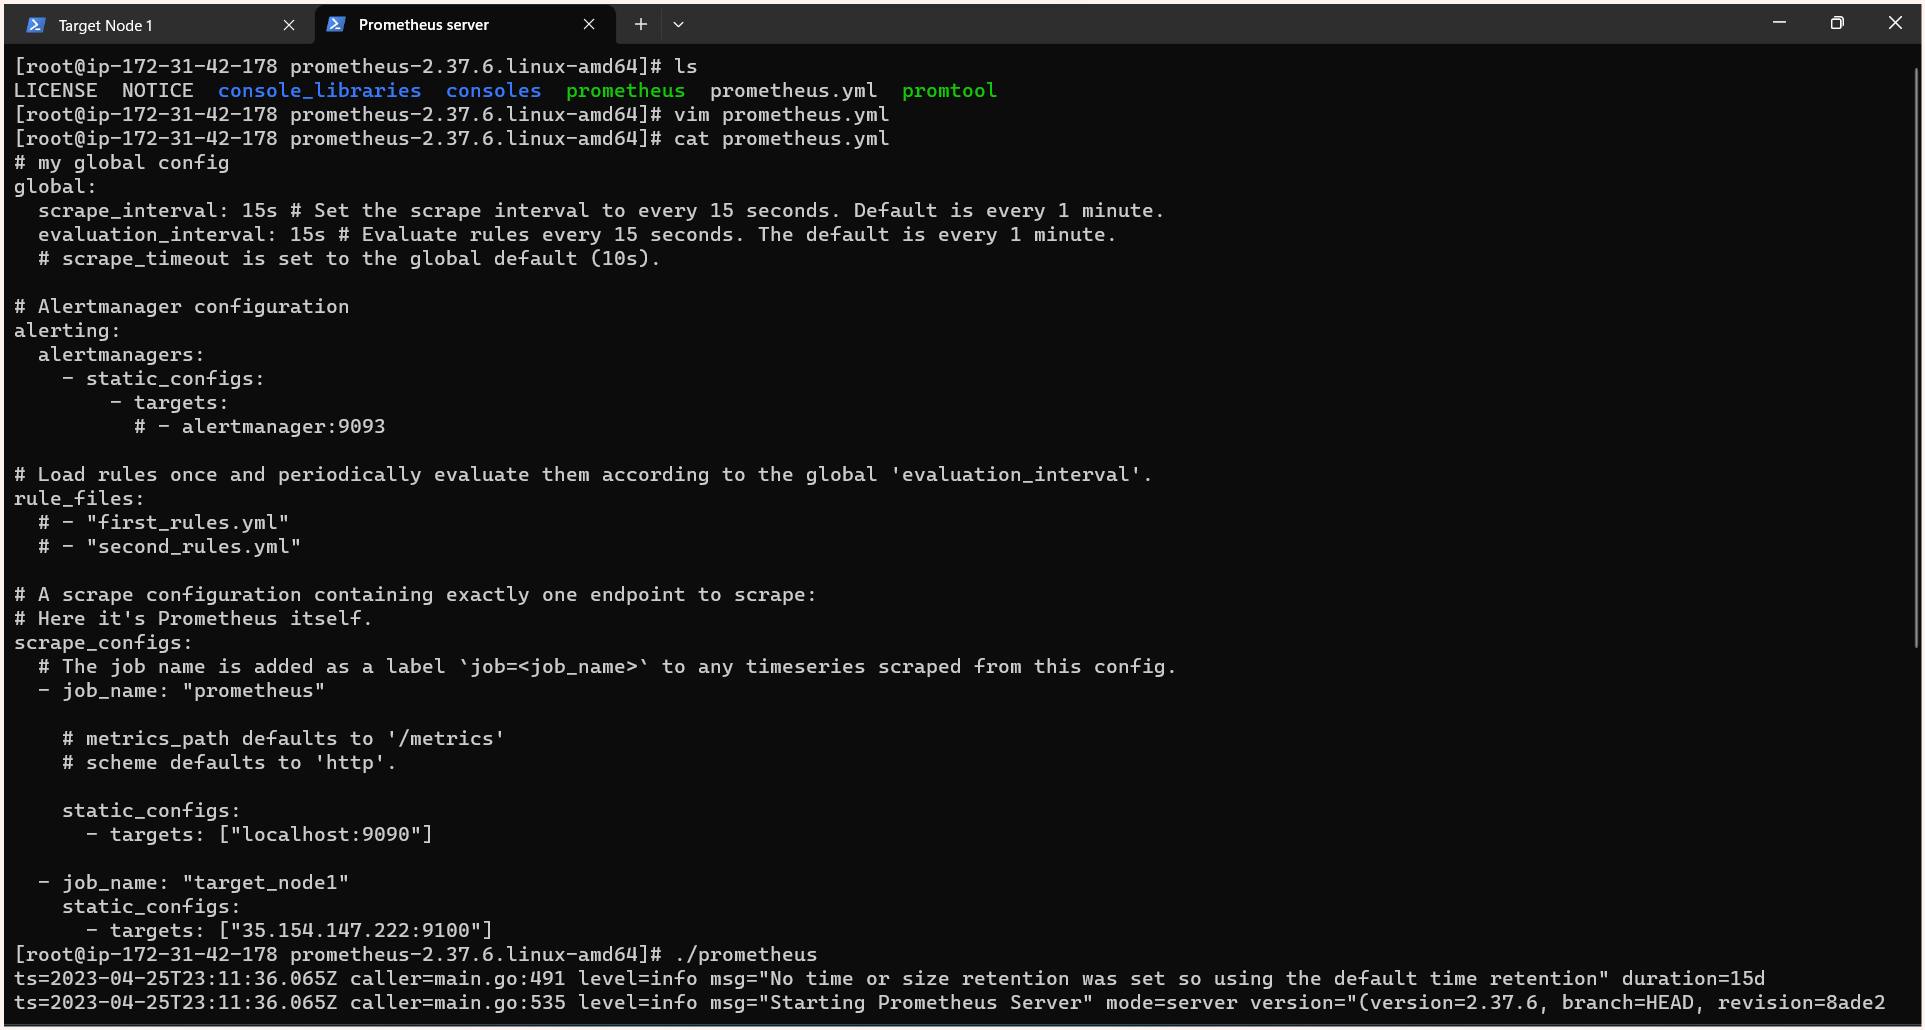
Prometheus.yml

# my global config
global:
  scrape_interval: 15s # Set the scrape interval to every 15 seconds. Default is every 1 minute.
  evaluation_interval: 15s # Evaluate rules every 15 seconds. The default is every 1 minute.
  # scrape_timeout is set to the global default (10s).

# Alertmanager configuration
alerting:
  alertmanagers:
    - static_configs:
        - targets:
          # - alertmanager:9093

# Load rules once and periodically evaluate them according to the global 'evaluation_interval'.
rule_files:
  # - "first_rules.yml"
  # - "second_rules.yml"

# A scrape configuration containing exactly one endpoint to scrape:
# Here it's Prometheus itself.
scrape_configs:
  # The job name is added as a label `job=<job_name>` to any timeseries scraped from this config.
  - job_name: "prometheus"

    # metrics_path defaults to '/metrics'
    # scheme defaults to 'http'.

    static_configs:
      - targets: ["localhost:9090"]

  - job_name: "target_node1"
    static_configs:
      - targets: ["35.154.147.222:9100"]
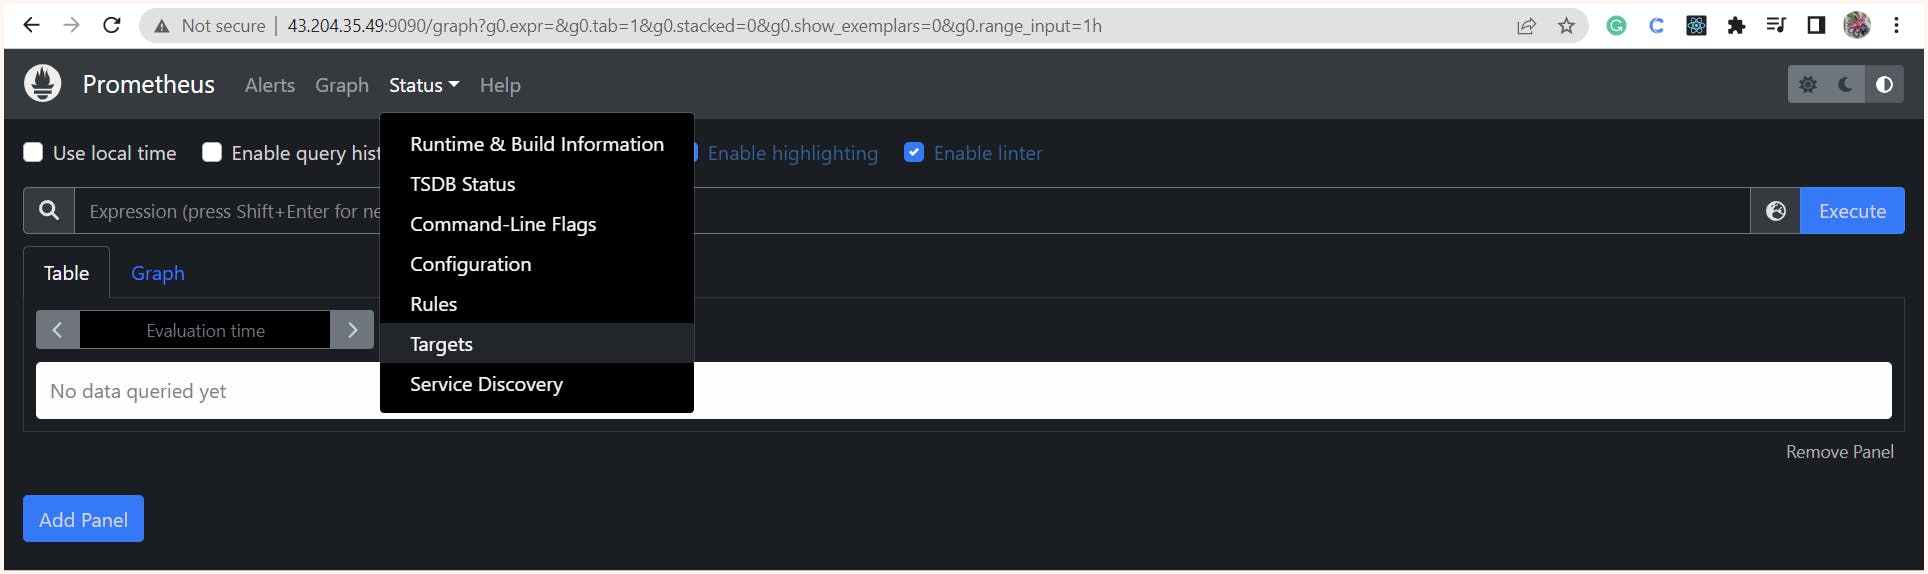
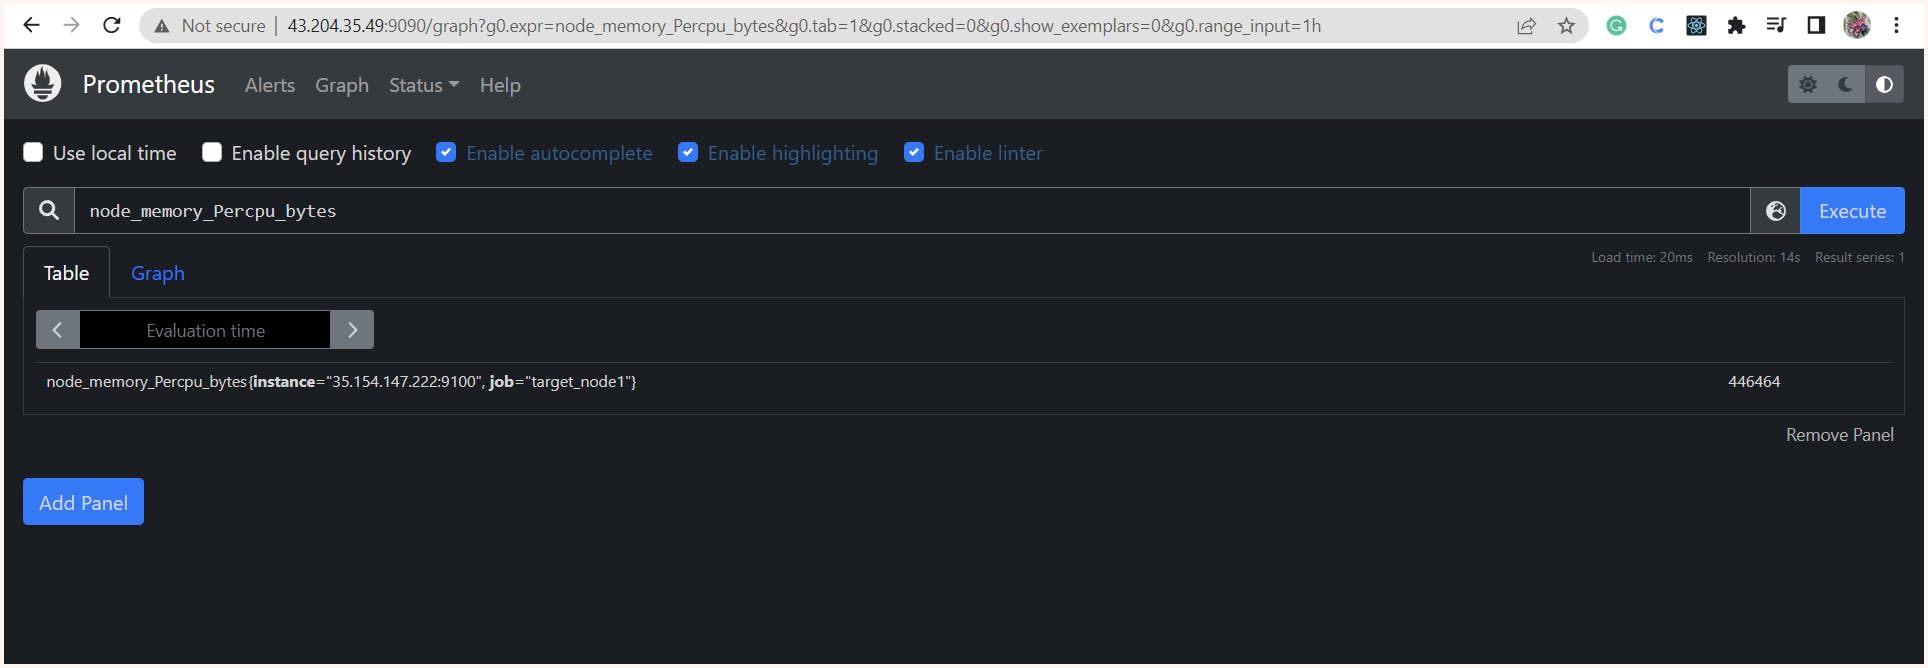
Once the configuration is complete, we can access the Prometheus console at http://<server_ip>:9090.
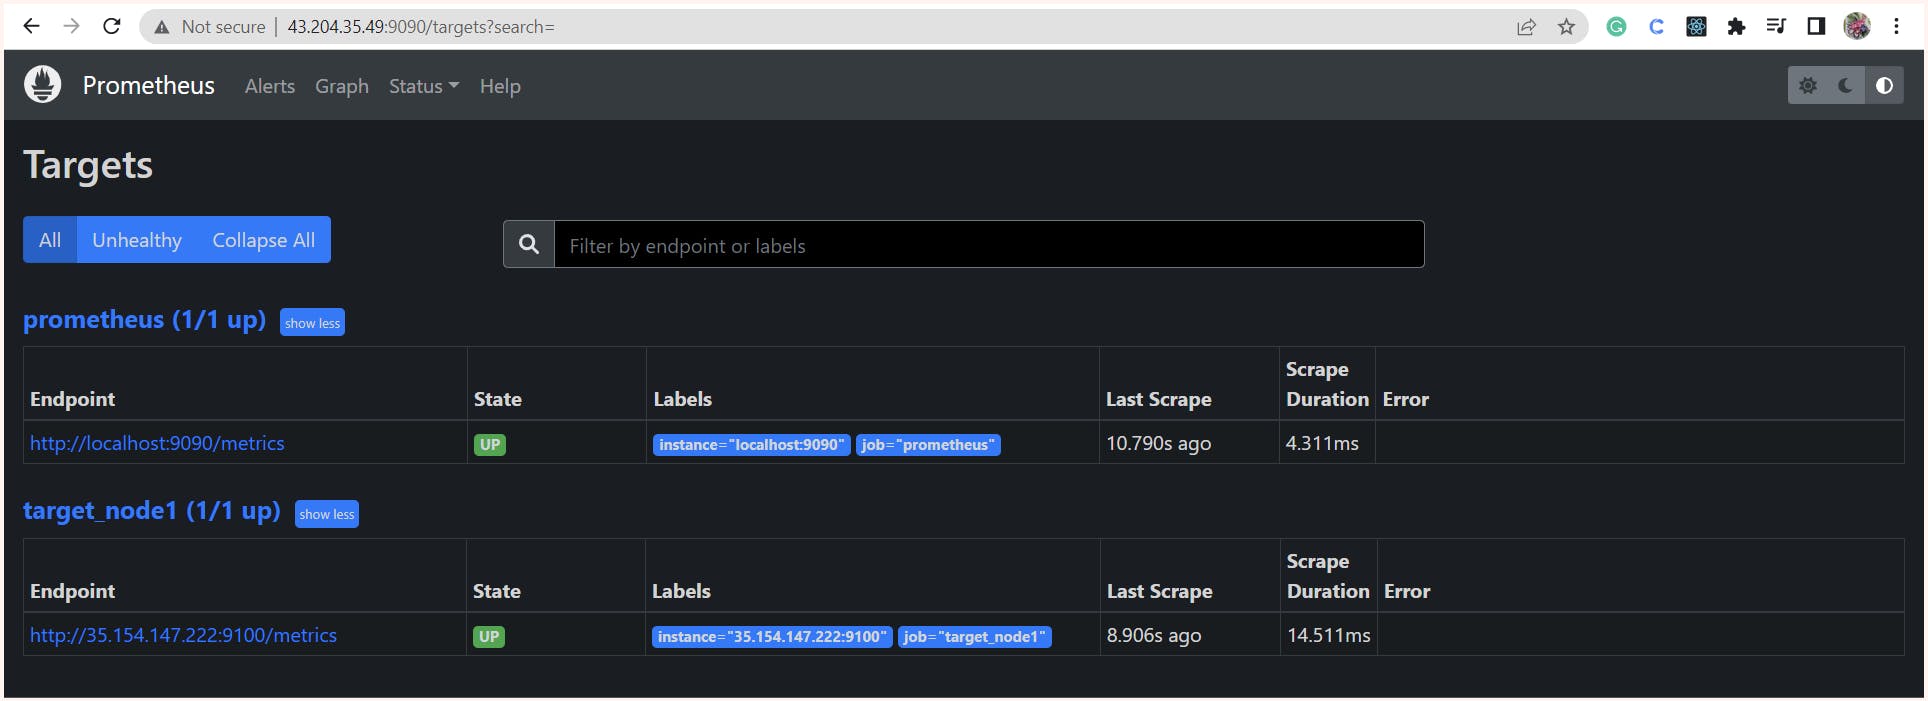
In the console, we can view the configured targets, including the Prometheus server itself and the machine with the node exporter. We also have the option to remove monitoring of the Prometheus server itself if we choose to do so. for this, we just need to remove the job named Prometheus.
Now that we have the console we can also search and query using a promQL query language.
Resources Links:
That's all for this blog, folks 🙌 Stay tuned for more amazing stuff on DevOps, Monitoring, and more such tech. Make sure to subscribe to our newsletter. 📫
Thank you For Reading :) #HappyLearning
Any query and suggestion are always welcome- Gaurav Pagare